Performance Analytics Dashboard
Through a dual-dimensional
development tasks + functional testingreal-time performance dashboard, it accurately presents 30+ key metrics and visual analysis, helping teams instantly grasp project progress, identify bottlenecks, optimize resource allocation, and drive a 40% improvement in R&D and testing efficiency.
I. Overall Architecture Overview
1. Multi-Dimensional Filtering System
Filter Area → Linked Dropdown Menus
- Organization Filter: Three-level drill-down by department/team/individual. Defaults to tenant-wide project data when unselected.
- View Toggle: One-click switch between "Tasks" and "Testing" views.
- Smart Association: Automatically syncs with the current iteration timeframe (e.g., 2024-09-16 to 2024-10-08).
2. Core Metrics Overview
| Metric | Real-Time Value | Healthy Threshold | Analytical Value |
|---|---|---|---|
| Total Tasks | 83 | / | Overall workload scale |
| Completion Rate | 30.38% | ≥70% | Progress lag alert (red) |
| First-Time Pass Rate | 100% | ≥85% | Quality compliance signal |
| Overdue Count | 59 | ≤5 | Process blockage alarm |
| Workload Saved | 29.0 | / | Quantified efficiency gain |
II. Development Task Efficiency Module
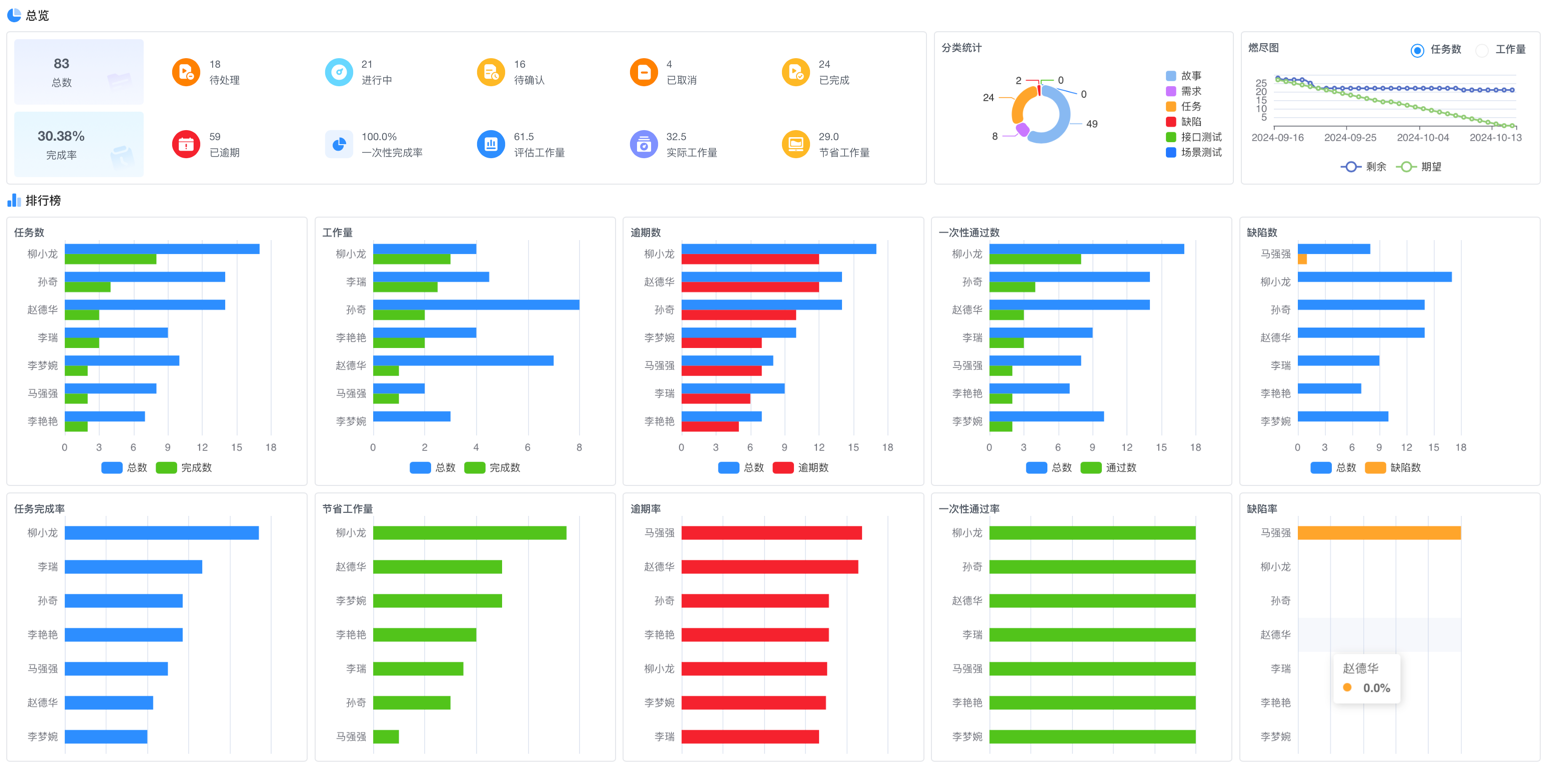
1. Multi-Dimensional Metrics Matrix
Task Lifecycle Monitoring:
| Status Category | Task Count | Description |
|---|---|---|
| Pending | 18 | Tasks not yet started |
| To Be Executed | 21 | Assigned but unexecuted tasks |
| Canceled | 16 | Invalid canceled tasks |
| Completed | 28 | Successfully finished tasks |
In-Depth Efficiency Analysis:
| Metric Category | Key Metric | Dashboard Display |
|---|---|---|
| Progress Tracking | 30.38% completion rate | Donut chart + trendline |
| Quality Assessment | 100% first-time pass rate | Green highlight |
| Resource Efficiency | 29.0 workload saved | YoY arrow ↑ |
| Risk Management | 59 overdue tasks | Red alert indicator |
2. Smart Analysis Tools
Task Burn-Down Chart:
| Date | Actual Remaining Tasks | Expected Remaining Tasks | Delta (Actual - Expected) | Progress Status |
|---|---|---|---|---|
| 2024-09-16 | 49 | 49 | 0 | On Track |
| 2024-09-20 | 20 | 35 | -15 | Ahead of Schedule |
| 2024-09-25 | 18 | 20 | -2 | Slightly Ahead |
| 2024-09-27 | 16 | 10 | +6 | Behind Schedule |
| 2024-10-08 | 0 | 0 | 0 | Completed on Time |
Insight Logic:
- Actual line consistently above expected → Resource shortage warning
- Sharp drop near deadline → Risk of rushed work
3. Efficiency Leaderboard
Three-Dimensional Talent Evaluation Model:
| Rank | Member Name | Total Tasks | Efficiency Rating | Task Share |
|---|---|---|---|---|
| 1 | Li Rui | 18 | ⭐⭐⭐⭐⭐ | 21.69% |
| 2 | Wang Sheng | 15 | ⭐⭐⭐⭐ | 18.07% |
| 3 | Li Yanwan | 12 | ⭐⭐⭐⭐ | 14.46% |
| 4 | Li Si | 9 | ⭐⭐⭐ | 10.84% |
| 5 | Zhao Dehua | 7 | ⭐⭐⭐ | 8.43% |
Analytical Dimensions:
- Total Task Ranking: Identify high-load members
- Completion Ranking: Discover efficient executors
- Workload Ranking: Quantify value output
III. Functional Testing Efficiency Module
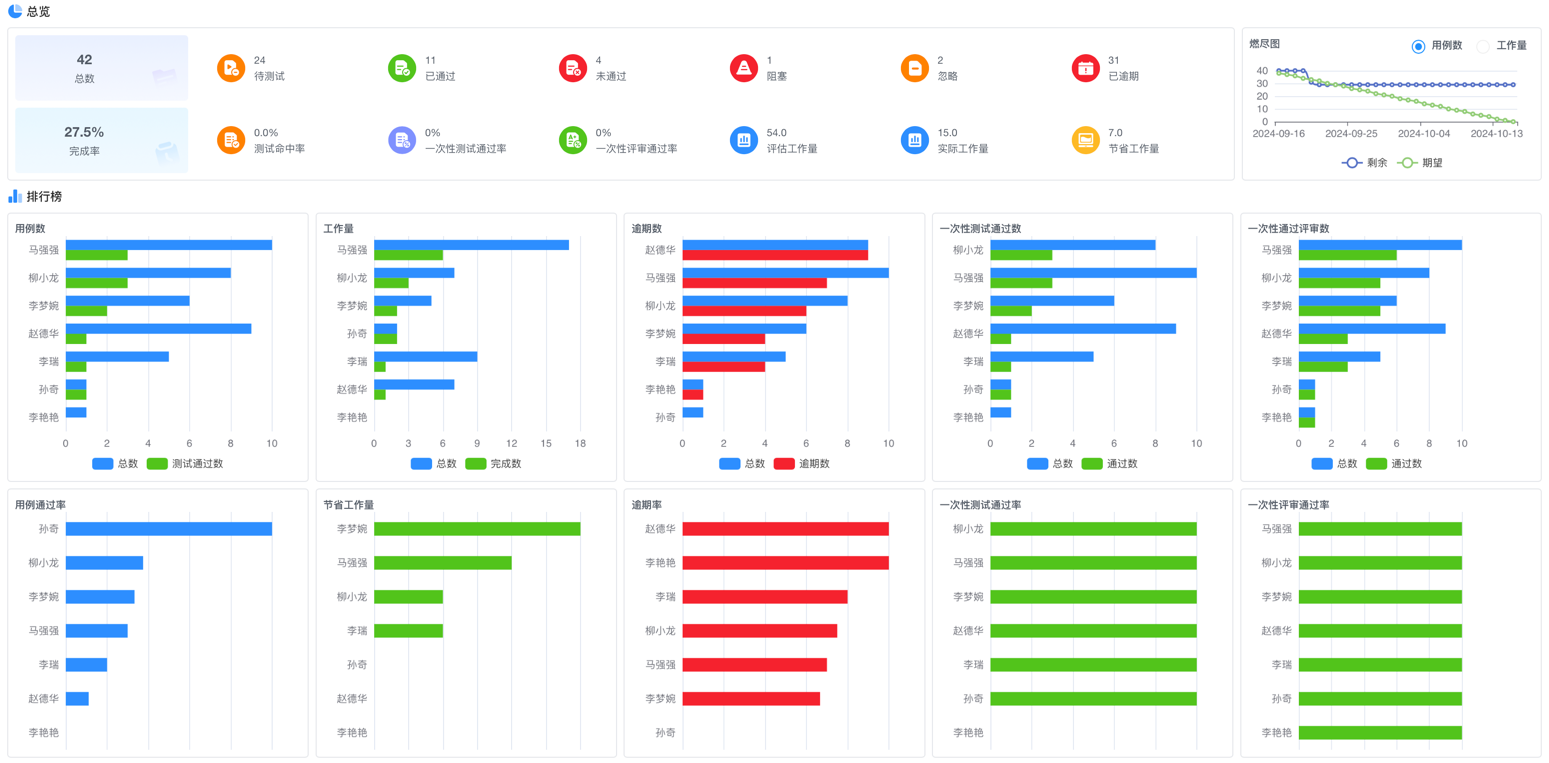
1. End-to-End Monitoring Metrics
Test Case Status Tracking:
| Status | Count | Share |
|---|---|---|
| Pending Testing | 24 | 28.9% |
| Canceled | 24 | 28.9% |
| Completed | 24 | 28.9% |
In-Depth Quality Analysis:
| Metric | Calculation Logic | Optimization Direction |
|---|---|---|
| Overdue Rate | Overdue count/Total | >15% requires process redesign |
| First-Time Pass Rate | First-pass count/Valid cases | <80% exposes test design flaws |
| Block Rate | Blocked cases/Total | >10% indicates environment issues |
2. Test Burn-Down Analysis
| Date | Remaining Cases | Target Cases | Delta (Actual - Target) | Status Evaluation |
|---|---|---|---|---|
| 2024-09-16 | 83 | 83 | 0 | Plan Start |
| 2024-09-20 | 60 | 50 | +10 | Severely Behind |
| 2024-09-25 | 40 | 25 | +15 | Significantly Behind |
| 2024-10-08 | 0 | 0 | 0 | Completed on Time |
Diagnostic Signals:
- Mid-cycle lag >15% → Need to increase testing resources
- Non-zero at deadline → Risk of delivery delay
3. Testing Efficiency Ranking
Talent Capability Profile:
| Rank | Member Name | Cases Completed | Efficiency Rating | Team Contribution |
|---|---|---|---|---|
| 1 | Li Rui | 18 | ⭐⭐⭐⭐⭐ | 40.0% |
| 2 | Li Yanwan | 15 | ⭐⭐⭐⭐ | 33.3% |
| 3 | Wang Kai | 12 | ⭐⭐⭐⭐ | 26.7% |
Core Dimensions:
- Defect Discovery Ranking: Quality guardians
- Case Pass Ranking: Efficient executors
- Workload Saved Ranking: Process optimizers
IV. Decision Support Scenarios
1. Daily Standup Sync
2. Iteration Retrospective
| Issue Type | Dashboard Evidence | Improvement Action |
|---|---|---|
| Scope Creep | Mid-cycle burn-up spike | Strengthen requirement freeze |
| Testing Delay | Lagging case completion | Introduce layered automation |
| Resource Misallocation | >50% member load variance | Dynamic balancing |
3. Performance Evaluation
Three-Dimensional Evaluation Model: