CTO Dashboard
A comprehensive project monitoring dashboard that presents real-time data across multiple dimensions such as
progress/resources/risks/quality, enabling technology decision-makers to instantly assess project health, identify critical bottlenecks, optimize resource allocation, and drive a 35%+ improvement in R&D efficiency.
I. Global Status Overview
1. Multi-Dimensional Filtering System
Filter Area → Interactive Dropdowns
- Organization Filter: Three-level drill-down (department/team/individual), defaults to tenant-wide project data when unselected
- View Toggle: One-click switch between "Tasks" and "Testing" views
- Smart Context: Auto-sync with current iteration timeframe (e.g., 2024-09-16 to 2024-10-08)
2. Core Metrics Summary
| Module | Metric | Real-Time Value | Health Status |
|---|---|---|---|
| Tasks | Overall Progress | 30.38% | ⚠️ Lagging |
| Total Tasks | 79 | Normal | |
| Overdue Rate | 74.68% | 🔴 High Risk | |
| Testing | Case Pass Rate | 68.5% | ⚠️ Critical |
| Defect Density | 15.8/KLOC | 🔴 Exceeded | |
| Test Coverage | 65% | ⚠️ Insufficient |
II. In-Depth Data Analysis Modules
1. Task Efficiency Analysis
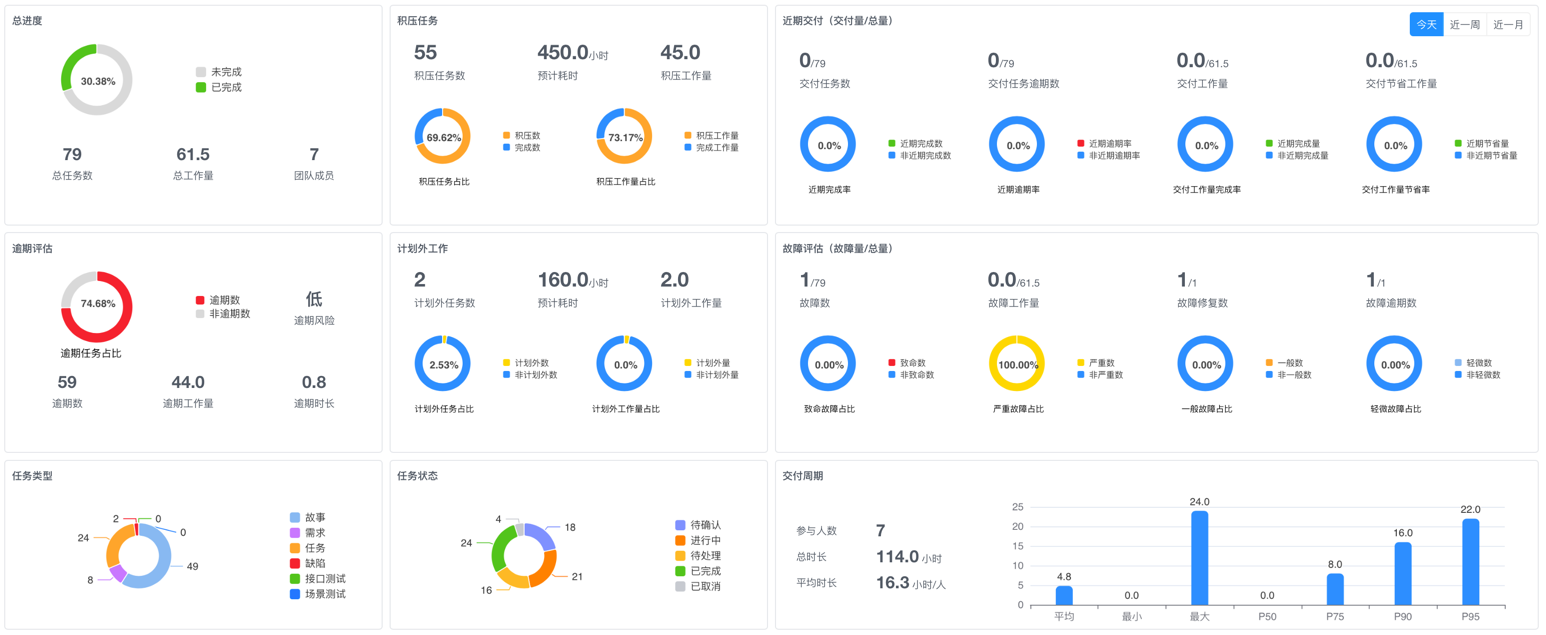
Backlog Dashboard
| Metric | Task Dimension | Test Dimension |
|---|---|---|
| Total Backlog | 55 Tasks | 1,875 Cases |
| Unplanned Ratio | 12% | 8% |
| Daily Processing Capacity | 3.2 Tasks | 48 Cases |
Delivery Efficiency Tracking
| Period | Task Completion Rate | Case Execution Rate |
|---|---|---|
| Today | 0% | 7% |
| Past Week | 24% | 45% |
| Past Month | 30% | 68% |
2. Testing Efficiency Analysis
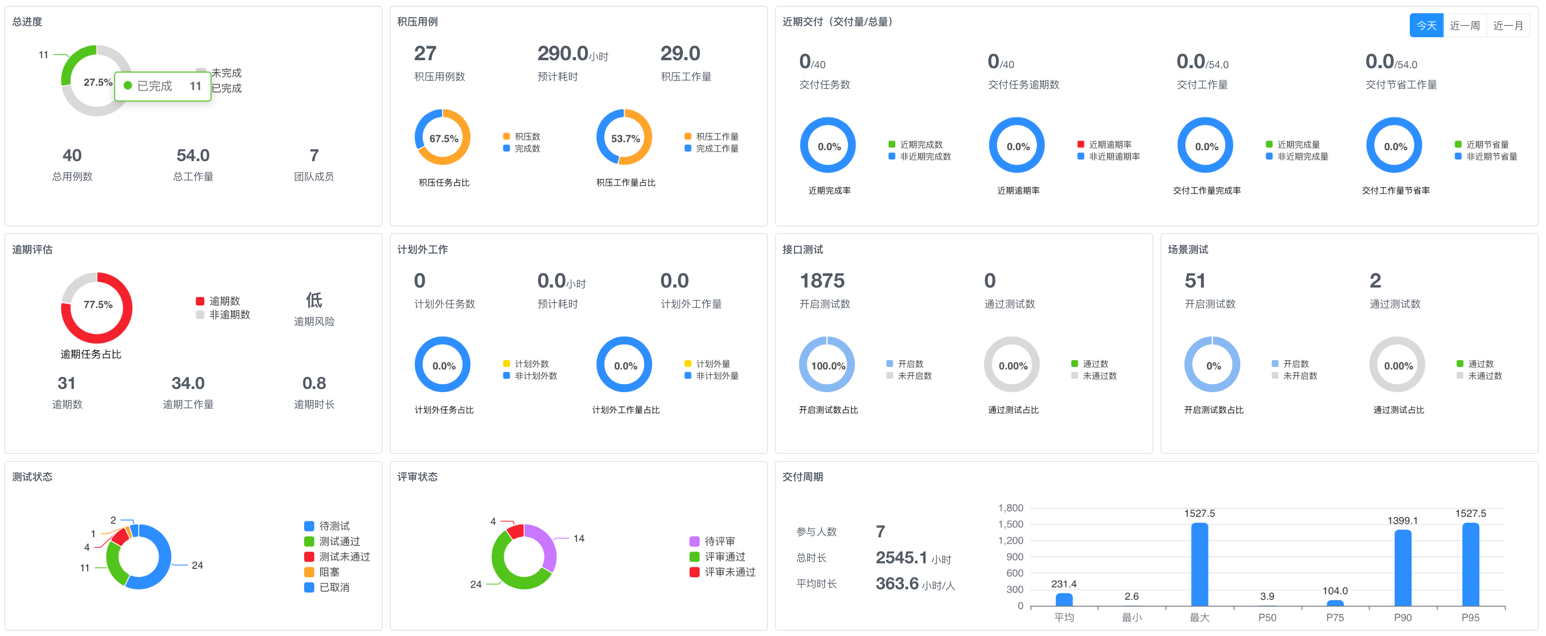
Quality Risk Radar
| Evaluation Dimension | Current Project Value | Healthy Baseline | Delta | Status Assessment |
|---|---|---|---|---|
| Coverage | 65% | 80% | -15% | ⚠️ Insufficient |
| Pass Rate | 68% | 85% | -17% | ⚠️ Below Standard |
| Defect Density | 15.8 | 5 | +10.8 | 🔴 Severely Exceeded |
| Automation Rate | 40% | 70% | -30% | 🔴 High Risk |
| Execution Efficiency | 55 | 75 | -20 | ⚠️ Below Standard |
Defect Distribution Matrix
| Severity | Count | Avg. Fix Time | Related Tasks |
|---|---|---|---|
| Critical | 12 | 8.2 hrs | Payment Module |
| Major | 31 | 16 hrs | Order System |
| Minor | 64 | 24 hrs | Common Features |
III. Resource Structure Analysis
1. Task Resource Distribution
| Type | Ratio | Team Load |
|---|---|---|
| Feature Development | 35% | 8.2h/person/day |
| Bug Fixing | 28% | 6.5h/person/day |
| Technical Optimization | 15% | 2.3h/person/day |
| Testing Tasks | 22% | 3.0h/person/day |
2. Testing Asset Distribution
| Asset Type | Count | Activity Rate |
|---|---|---|
| API Cases | 1,875 | 85% |
| Scenario Cases | 254 | 75% |
| Automation Scripts | 51 | 68% |
| Mock Services | 7 | 92% |
IV. Core Efficiency Metrics
1. Team Capability Matrix
| Capability Dimension | Dev Team | Test Team | Δ Value |
|---|---|---|---|
| Delivery Efficiency | 0.8 tasks/person/day | 12 cases/person/day | +25% |
| First-Time Pass Rate | 75% | 68% | -7% |
| Defect Detection | 22 defects/KLOC | 15.8 defects/KLOC | -28% |
| Knowledge Retention | 2.1 docs/person | 1.4 docs/person | -33% |
2. Quality Health Baseline
| Dimension | Current Value | Healthy Baseline | Gap | Risk Level |
|---|---|---|---|---|
| Code Quality | 70% | 85% | -15% | ⚠️ Medium Risk |
| Test Coverage | 65% | 80% | -15% | ⚠️ Medium Risk |
| Defect Density | 15.8 | 5 | +10.8 | 🔴 High Risk |
| Automation Rate | 40% | 70% | -30% | 🟠 High Risk |
V. Intelligent Decision Engine
1. Bottleneck Identification System
2. Optimization Decision Matrix
| Problem Area | Task-Side Actions | Test-Side Actions | Expected Benefit |
|---|---|---|---|
| Payment Module Delay | 1. Split complex tasks 2. Daily code reviews | 1. Prioritize core path testing 2. Streamline acceptance | 40% faster delivery |
| High Defect Density | 1. Strengthen unit testing 2. Adopt AI-assisted coding | 1. Enhance static scanning 2. Build defect prediction model | 60% defect reduction |
| Low Automation Rate | 1. Provide test interface specs | 1. Script generation tools 2. Record-playback system | 30% automation boost |
3. Risk Alert Dashboard
| Risk Type | Task Dimension | Test Dimension | Joint Solution |
|---|---|---|---|
| Schedule Risk | >70% overdue rate | >15% blocked cases | Cross-team standups |
| Quality Risk | >40% defect recurrence | <50% automation rate | Red/Blue quality drills |
| Resource Risk | >7h/person/day load | >60 cases/person | Dynamic elastic allocation |