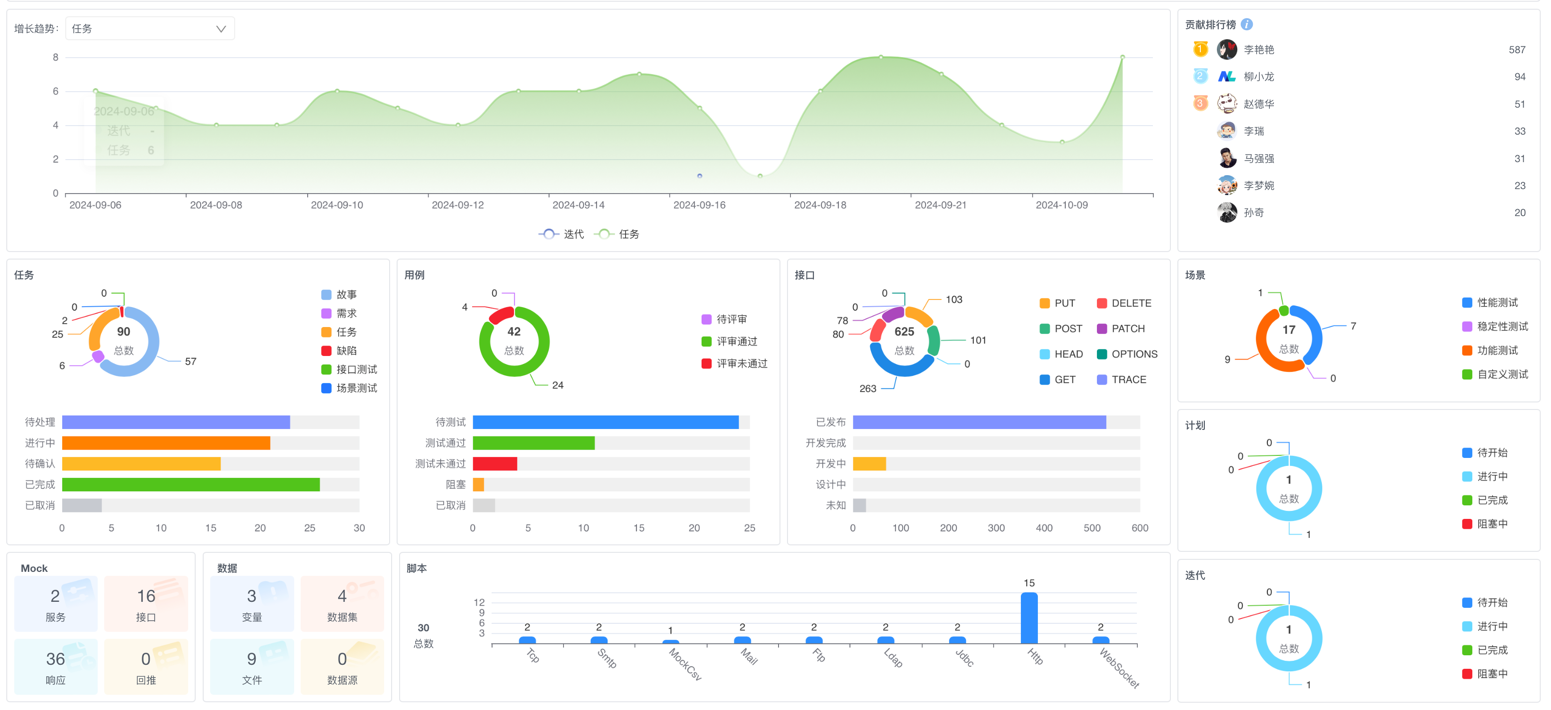
Data Asset Dashboard
Through a panoramic data asset visualization dashboard, real-time aggregation of
8 major categoriesof R&D asset data is achieved, providing cross-dimensional intelligent analysis to help teams instantly grasp resource distribution, identify bottlenecks, and optimize asset allocation, improving R&D resource utilization by 40%+.
I. Global Asset Overview
1. Multi-dimensional Filtering System
Filter Area → Interactive Dropdown Menus
- Organization Filter: Department/Group/Individual three-level drill-down. Defaults to tenant-wide current project data when unselected
- Custom Time Range: Automatically syncs aggregated data for the current custom time period
2. Core Asset Growth Trends
| Asset Type | Timeline Metrics | Analytical Value |
|---|---|---|
| Tasks | Daily/Accumulated Volume | Project Load Warning |
| APIs | Version Iteration Trends | API Governance Optimization |
| Scripts | Type Distribution Changes | Automation Coverage Rate |
3. Aggregate Asset Cards
| Asset Type | Current Value | WoW Change |
|---|---|---|
| Total Tasks | 236 | ↑12% |
| Valid APIs | 625 | ↑8% |
| Test Scripts | 91 | ↑15% |
| Mock Assets | 103 | ↑5% |
II. Multi-dimensional Asset Analysis Modules
1. Task Asset Analysis
Status Matrix:
| Status Type | Task Count | Percentage |
|---|---|---|
| Pending | 24 | 11.48% |
| In Progress | 36 | 17.22% |
| Pending Review | 16 | 7.66% |
| Completed | 103 | 49.28% |
| Canceled | 30 | 14.35% |
| Total | 209 | 100% |
Type Breakdown:
| Task Type | Count | % | Priority Distribution |
|---|---|---|---|
| Requirements | 58 | 25% | High:40%, Medium:45%, Low:15% |
| Defects | 62 | 26% | Critical:35%, High:50%, Medium:15% |
| API Tests | 46 | 19% | Automation Rate:75% |
2. Test Case Analysis
Quality Status Distribution:
| Status | Count | Health Indicator |
|---|---|---|
| Pending Test | 10 | ⚠️ Overdue Risk |
| Passed | 25 | ✅ Compliant |
| Failed | 20 | 🔴 Urgent Attention Needed |
Review Status Dashboard:
| Review Status | Case Count | Percentage |
|---|---|---|
| Pending Review | 15 | 16.67% |
| Approved | 70 | 77.78% |
| Rejected | 5 | 5.56% |
| Total | 90 | 100% |
3. API Asset Analysis
Protocol Type Distribution:
| Method | Count | % | Avg Response |
|---|---|---|---|
| GET | 103 | 45% | 280ms |
| POST | 100 | 44% | 320ms |
| PUT | 93 | 4% | 350ms |
| DELETE | 91 | 4% | 310ms |
Lifecycle Statistics:
| Status | Count | Trend |
|---|---|---|
| Designing | 28 | ↓5% |
| Developing | 42 | →Steady |
| Completed | 101 | ↑12% |
4. Script Asset Analysis
Test Type Distribution:
| Test Type | Count | Coverage |
|---|---|---|
| Functional | 78 | Core Flows 100% |
| Performance | 60 | Key APIs 80% |
| Stability | 31 | Payment Module 100% |
| Custom | 17 | Special Business Scenarios |
III. Contribution Value System
1. User Contribution Leaderboard
| Rank | Member | Score | Primary Contribution Area |
|---|---|---|---|
| 1 | Li Yanyan | 587 | API Development, Case Design |
| 2 | Wang Hua | 94 | Performance Test Scripts |
| 3 | Zhao Dehua | 51 | Automation Script Development |
2. Contribution Calculation Model
Contribution Score = Sum of Test Cases + APIs + Tasks + Scenarios + Scripts + Parameter Data + Reports + Mock APIs
IV. Special Asset Monitoring
1. Mock Asset Dashboard
| Resource Type | Count | Utilization |
|---|---|---|
| Mock Services | 101 | 78% |
| Mock APIs | 623 | 85% |
| Mock Responses | 80 | 92% |
| Mock Callbacks | 78 | 65% |
2. Data Resource Analysis
Data Asset Matrix:
| Type | Count | Linked Cases |
|---|---|---|
| Variables | 17 | 98 Cases |
| Datasets | 1 | 12 Scenarios |
| Data Sources | 2 | Core Payment System |
3. Report Asset Distribution
| Report Type | Count | Generation Frequency |
|---|---|---|
| Performance | 36 | Daily |
| Functional | 25 | Per Iteration |
| Automation | 16 | Real-time |