AngusTester Error Diagnosis and Resource Bottleneck Identification Guide
Why Analyze Errors and Resource Bottlenecks
Diagnosing errors and resource bottlenecks is critical for system health:
- Stability Assurance: Detect and fix potential failure points before production crashes
- Performance Optimization: Pinpoint bottlenecks for targeted improvements
- Cost Control: Prevent resource over-provisioning and optimize ROI
- Capacity Planning: Provide data-driven basis for system scaling
- SLA Compliance: Ensure critical service level agreement metrics are met
Diagnosis and Analysis Workflow
⚡ Error Analysis Workflow
- Identify high-error time windows
- Analyze error type distribution
- Correlate status code patterns
- Trace logs to locate root cause
⚡ Performance Baseline Establishment
- Create zero-latency benchmark interface
- Capture network-layer performance data
- Eliminate business logic interference
Professional Error Analysis Process
1. Global Error Trend Analysis
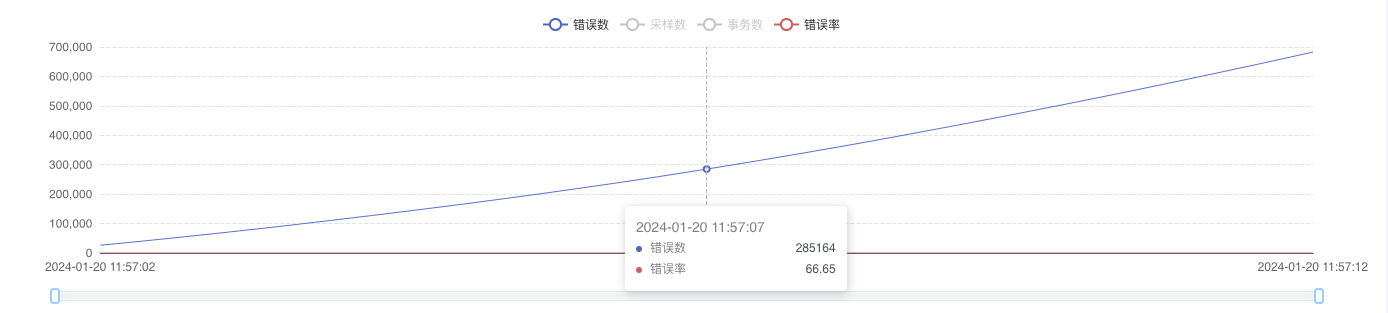
- Key Observation Metrics:
- Total error trend curve
- Error rate change pattern
- Error occurrence time distribution
2. Root Cause Classification
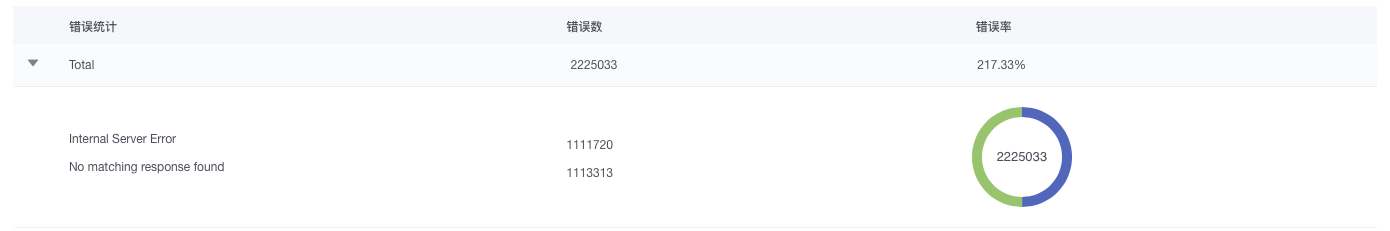
Error Type Diagnosis Matrix:
| Error Category | Typical Causes | Resolution Suggestions |
|---|---|---|
| Connection Timeout | Network interruption/firewall restrictions | Check network config & security policies |
| Service Denial | Service overload/thread pool exhaustion | Scale nodes/adjust thread pool config |
| Protocol Error | API changes/version incompatibility | Validate API compatibility |
| Data Validation Failure | Data format changes/validation logic updates | Update test dataset |
| System Exception | Memory leaks/resource exhaustion | Resource monitoring & troubleshooting |
3. HTTP Status Code Analysis
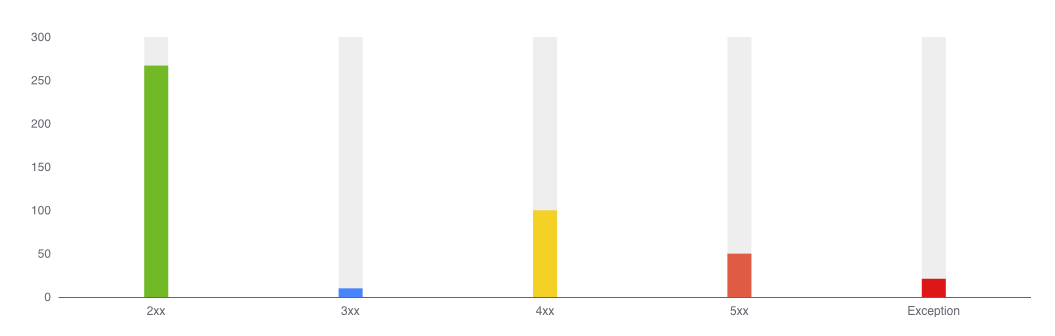
Key Status Code Diagnosis Guide:
4xxClient Errors:401/403: Authentication/authorization issues404: API path changes429: Rate limiting triggered
5xxServer Errors:500: Unhandled server exceptions502/503: Upstream service unavailable504: Service response timeout
Precise Resource Bottleneck Identification
1. CPU Resource Analysis
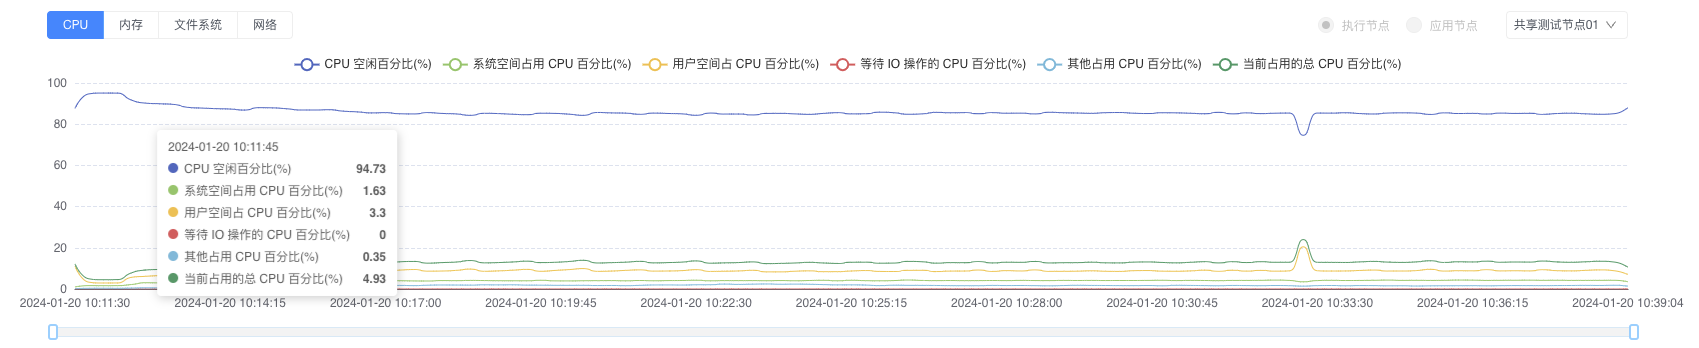
CPU Metric Interpretation Table:
| Metric | Healthy Range | Risk Threshold | Symptoms | Optimization Suggestions |
|---|---|---|---|---|
| User-space CPU | <60% | >75% | High app logic consumption | Code optimization/thread control |
| System-space CPU | <20% | >40% | High kernel scheduling overhead | System tuning/interrupt optimization |
| I/O Wait CPU | <10% | >30% | Storage bottleneck | SSD upgrade/IO scheduler tuning |
| Idle CPU | >25% | <10% | Resource shortage | Node scaling |
| Total Utilization | <75% | >85% | Overall overload | Service decomposition/load balancing |
2. Memory Resource Analysis
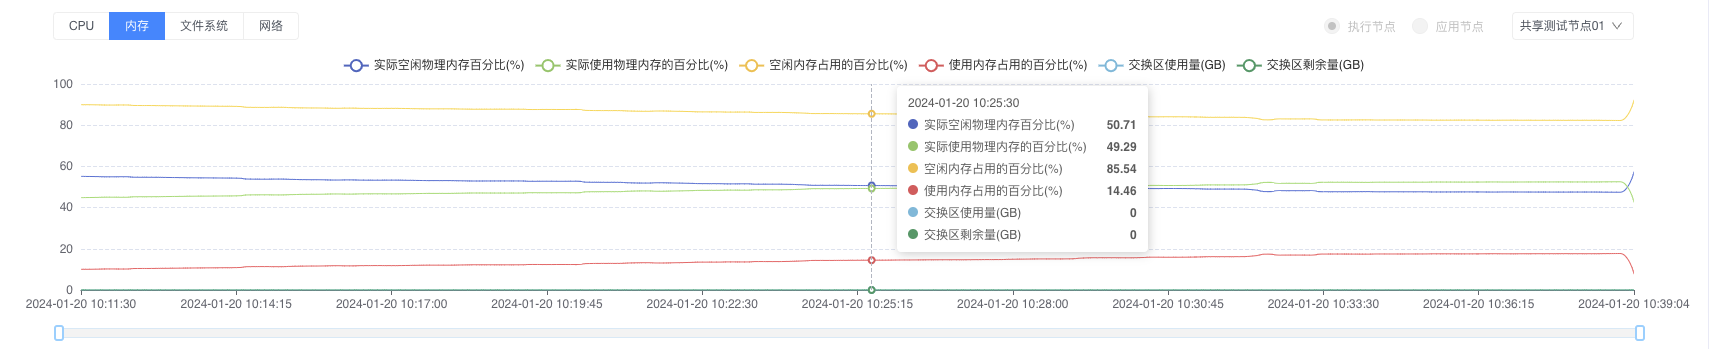
Memory Problem Diagnosis Tree:
- High Memory Usage:
- Application memory leak → Heap analysis tools
- Excessive cache usage → Cache strategy optimization
- Abnormal Swap Usage:
- Physical memory shortage → Memory scaling
- Incorrect swap configuration → Adjust swappiness
3. Storage Performance Analysis
IOPS Throughput Analysis
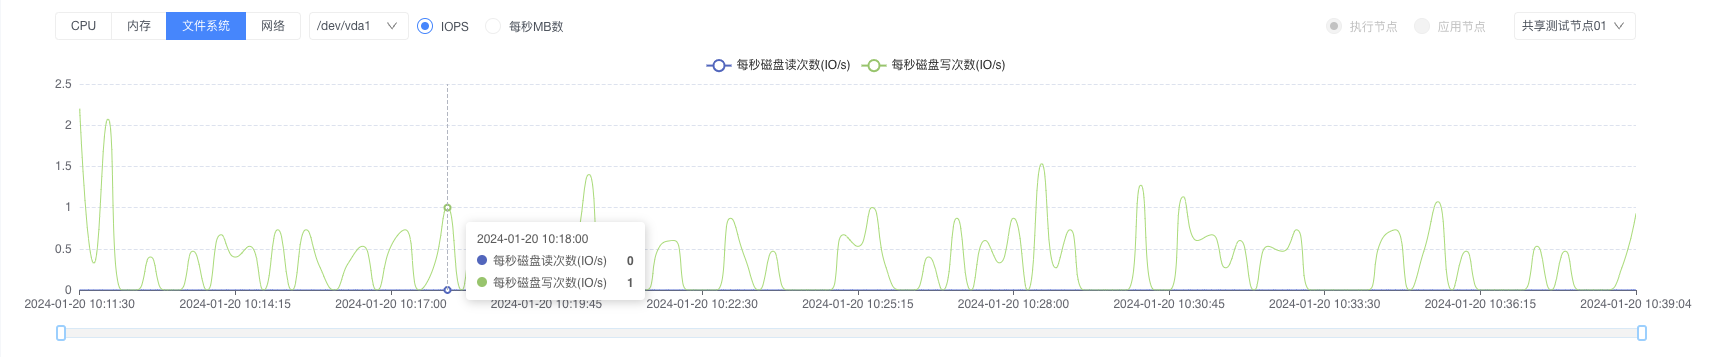 Focus: Peak R/W operation frequency vs response latency correlation
Data Throughput Analysis
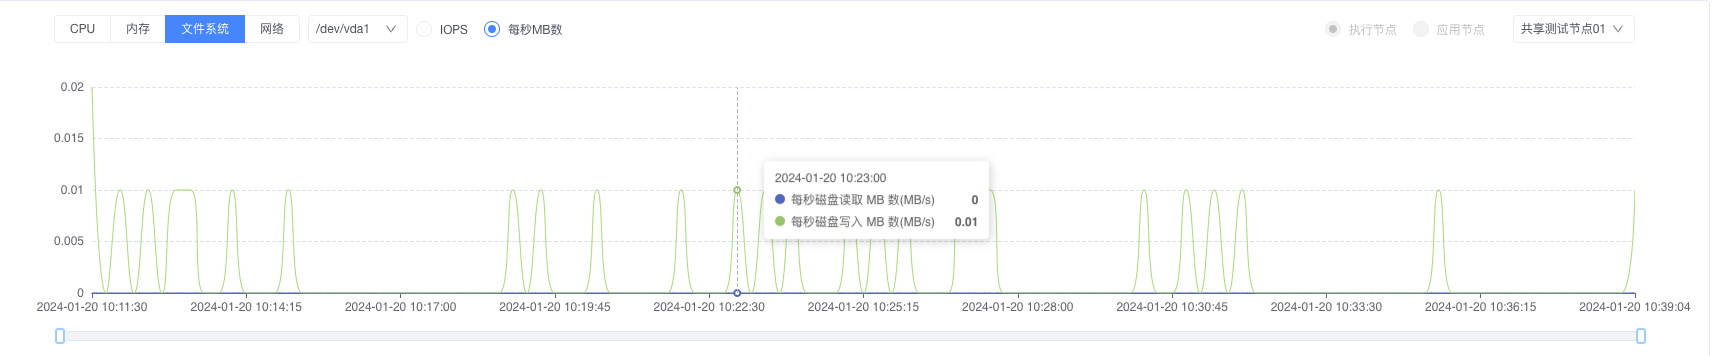 Key Diagnosis: Data transfer bandwidth vs network capacity matching
Storage Optimization Matrix:
| Problem Type | Detection Method | Optimization Strategy |
|---|---|---|
| IOPS Bottleneck | Monitor R/W operation frequency | SSD upgrade/RAID optimization |
| Throughput Limit | Check data transfer rate | Striped storage/10GbE network |
| High Latency | Track IO response time | Cache strategy/filesystem tuning |
4. Network Traffic Analysis
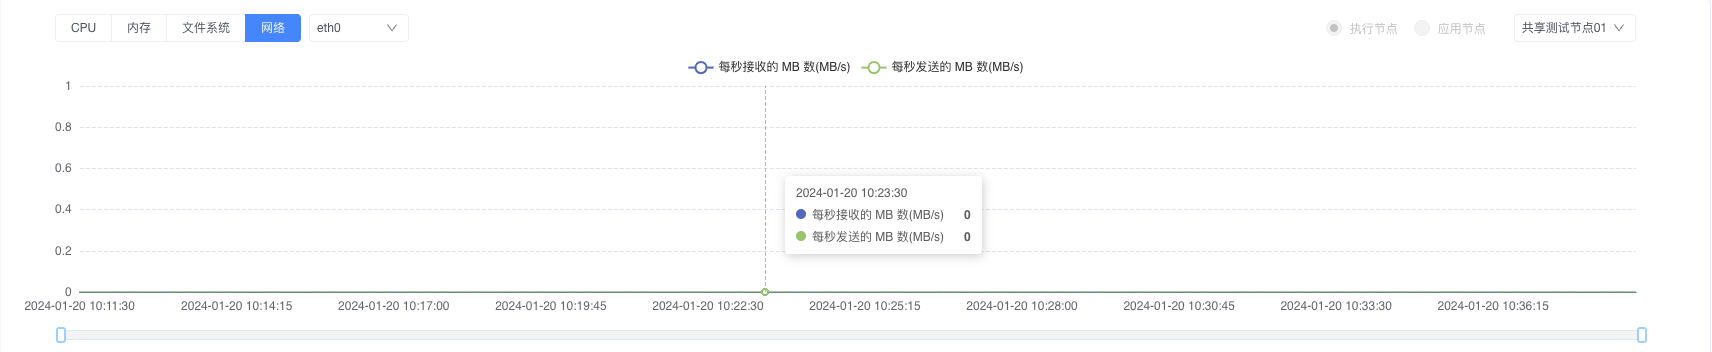
Network Diagnosis Metrics:
| Metric | Healthy Standard | Problem Indicator | Optimization Suggestions |
|---|---|---|---|
| Inbound Traffic | <80% bandwidth | Sustained exceedance | Bandwidth scaling/CDN implementation |
| Outbound Traffic | <80% bandwidth | Sustained exceedance | P2P optimization/data compression |
| Packet Error Rate | <0.1% | >1% | Driver update/hardware check |
| Connection Count | <80% max | >90% | Connection pool tuning/port expansion |
Expert Optimization Recommendations
Correlation Analysis Principle:
- Correlate error spikes with resource usage peaks
- Monitor error rate vs response time correlation
Capacity Planning Formula:
Required Nodes = (Current Peak TPS × Growth Factor) / (Max TPS per Node × Redundancy Factor)
3. **Monitoring Alert Strategy**:
 - Error rate >0.1% for 5+ minutes triggers warning
 - CPU >80% for 10+ minutes triggers scaling alert
 - Memory usage >85% triggers leak detection

<br>

**Start Error Diagnosis and Bottleneck Analysis Now**: [🔗 Enter AngusTester Console 🔗](https://gm.xcan.cloud/signin){ .md-button .md-button--primary }